A data-driven commentary on South Africa's electricity pricing crisis, it’s devastating impact on energy-intensive industry, and the emergency intervention to save the ferrochrome sector by Davies Tsikayi
South Africa’s electricity tariffs have increased rapidly since 2003, turning what was once some of the world’s most affordable industrial power into a cost structure that has contributed significantly to deindustrialisation. The underlying dataset indicates that average electricity tariffs increased from 16.05 c/kWh in 2003 to 178.63 c/kWh in 2024/25, representing a compound escalation of approximately 11.1‑times over the 21‑year period. During this same period, total electricity sales volumes declined from a peak of 256,959 GWh to 189,723 GWh, and industrial consumption fell by nearly 40% from its peak. Revenue, however, still increased over time, from R31.6 billion to R338.9 billion, reflecting the effect of rising tariffs on a progressively smaller customer base.
It is against this backdrop that the government's announcement of a 62 c/kWh emergency electricity tariff for ferrochrome smelters must be understood, not as a subsidy, but as a course correction for a pricing regime that has systematically destroyed the very industrial base it was meant to serve.
The Numbers Tell the Story
Historical South African electricity pricing data, spanning 22 financial years from 2003 to 2024/25, shows a sustained and steep tariff escalation. While the rate of increase varies by customer category, the upward trend has affected all sectors.
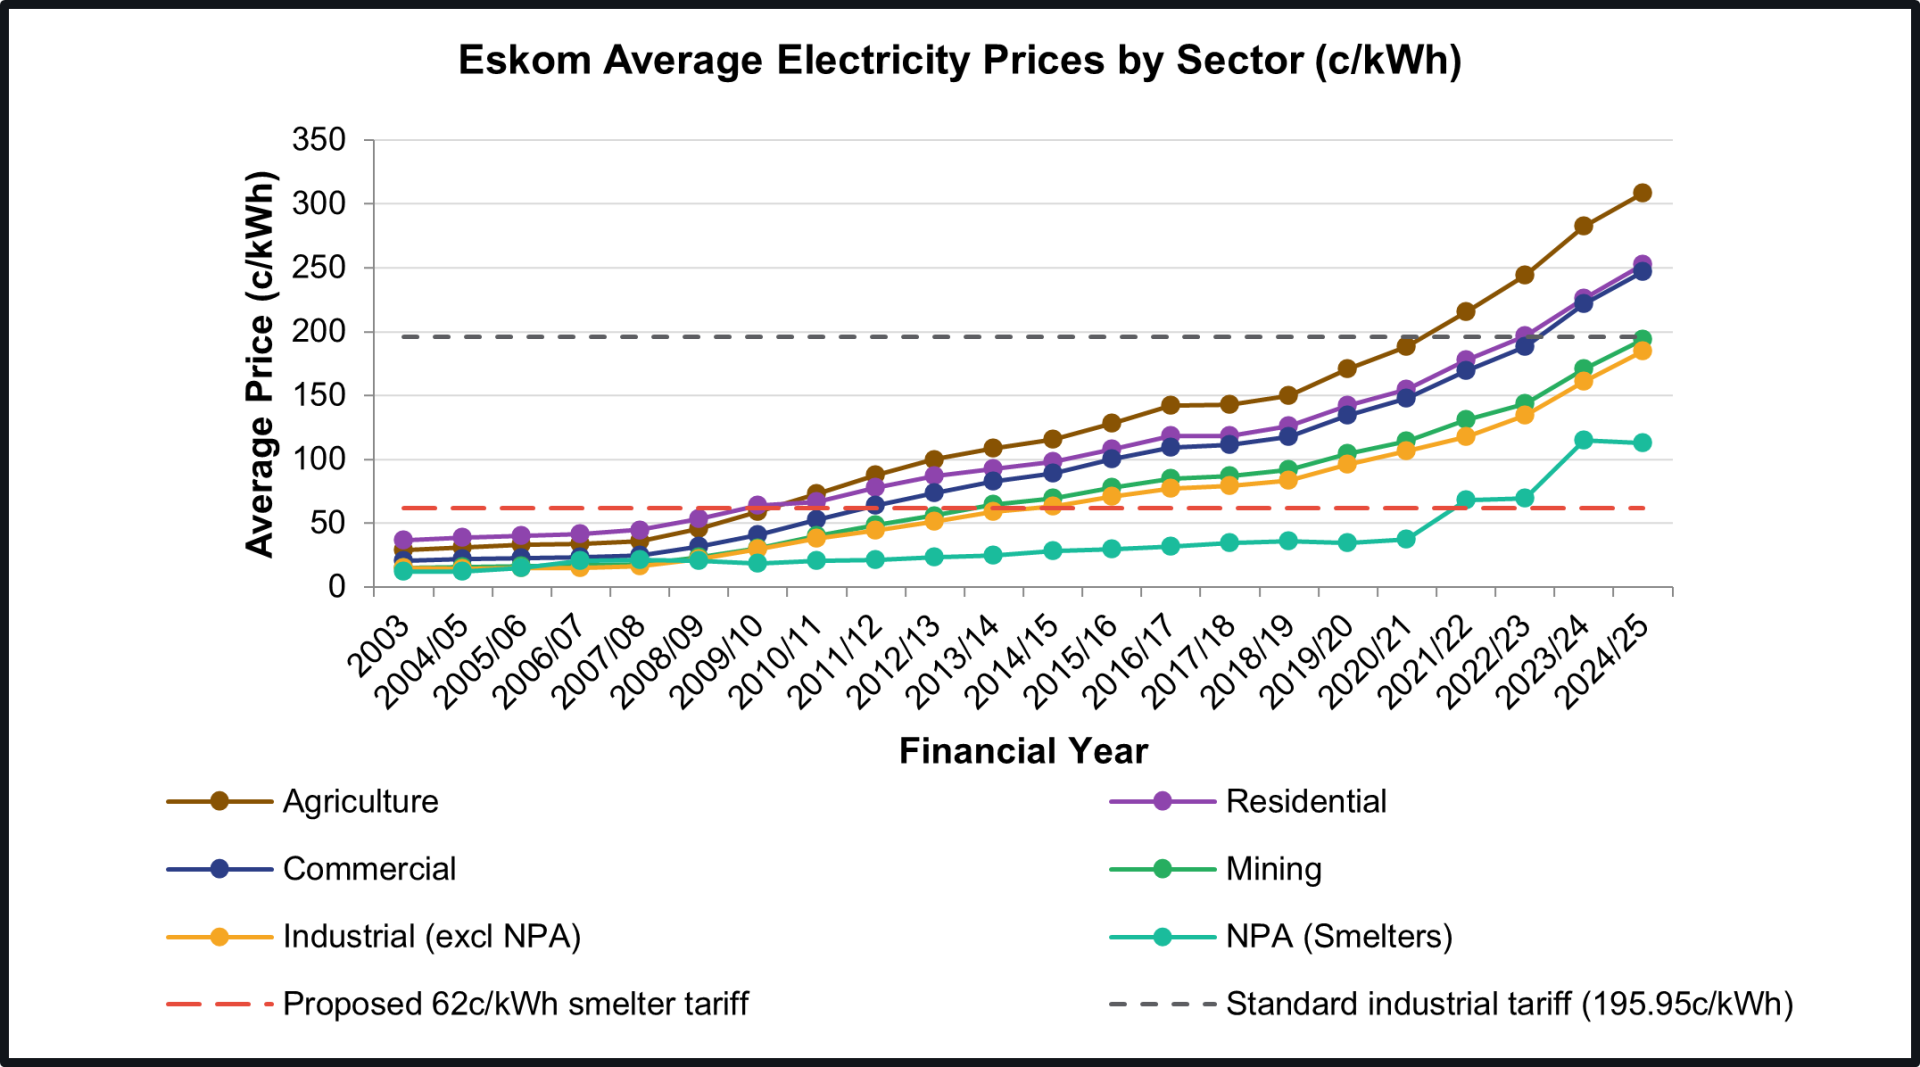
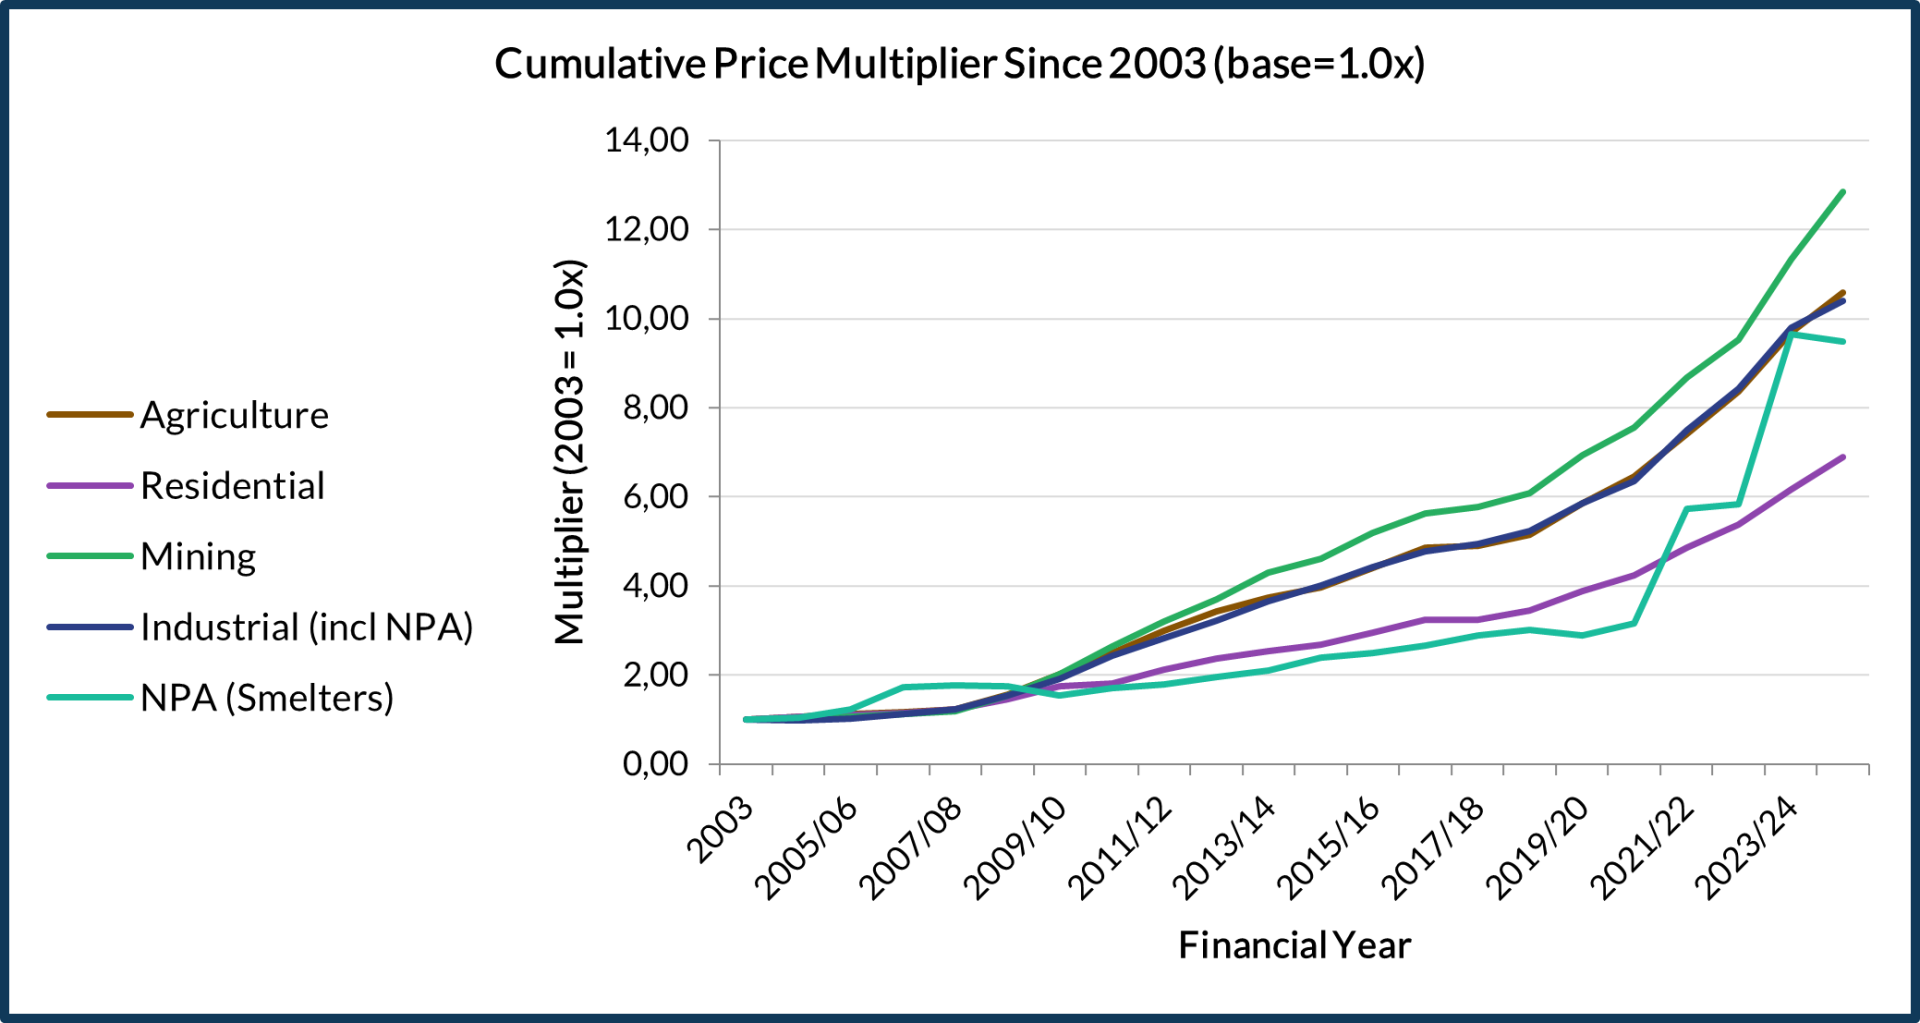
Customer Category | 2003 Price (c/kWh) | 2024/25 Price (c/kWh) | Total Increase (Multiple) |
| Agriculture | 29.14 | 308.19 | 10.6x |
| Mining | 15.07 | 193.70 | 12.9x |
| Industrial (excl NPA) | 14.73 | 184.80 | 12.5x |
| Overall Average | 16.05 | 178.63 | 11.1x |
| Residential | 36.58 | 252.52 | 6.9x |
| NPA (Smelters) | 11.88 | 112.64 | 9.5x |
Agriculture, the backbone of rural employment, has been hit hardest, with tariffs climbing from 29.14 c/kWh to 308.19 c/kWh. Mining, another employment‑intensive sector, saw a 12.9× increase. The industrial sector (excluding Negotiated Pricing Agreements) experienced a 12.5× increase, rising from 14.73 c/kWh to 184.80 c/kWh. Standard industrial tariffs without any NPA discount now sit at approximately 195.95 c/kWh, which is nearly R2 per kWh.
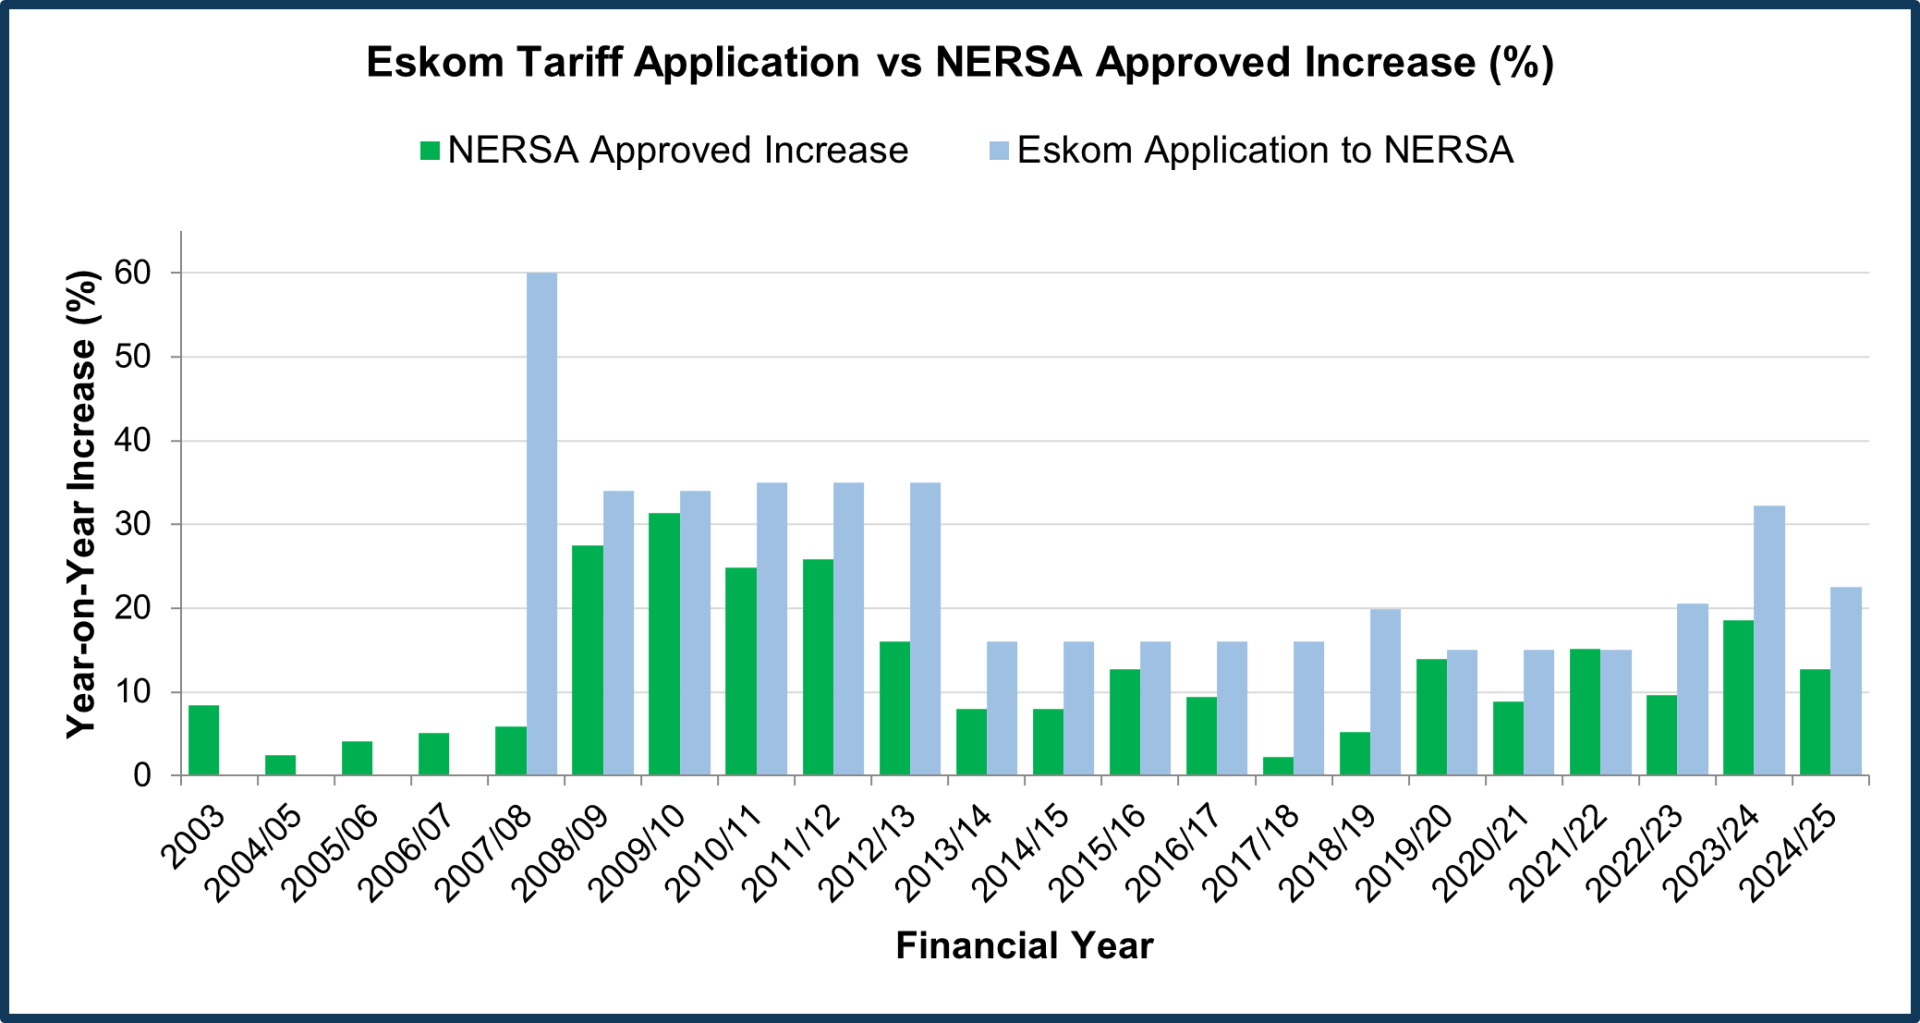
A significant shift occurred during the Multi‑Year Price Determination (MYPD) 2 period, when NERSA approved five consecutive years of double‑digit tariff increases.
| Financial Year | NERSA Approved Increase | Eskom Originally Requested |
| 2008/09 | 27.5% | 60.0% (revised from 5.9% to 18.7% then 60%) |
| 2009/10 | 31.3% | 34.0% |
| 2010/11 | 24.8% | 35.0% |
| 2011/12 | 25.8% | 35.0% |
| 2012/13 | 16.0% | 35.0% |
Over the five‑year MYPD2 period, NERSA approved cumulative tariff increases of more than 200%. During this time, applications for higher annual adjustments were submitted, including a 60% request for 2008/09 and 34–35% requests in subsequent years. Although NERSA moderated these applications, the resulting approved increases contributed to a significant rise in electricity costs for energy‑intensive users. The increases were largely driven by the need to support major capital expansion projects such as Medupi and Kusile. These pricing developments, however, coincided with a decline in the competitiveness of energy‑intensive industries.
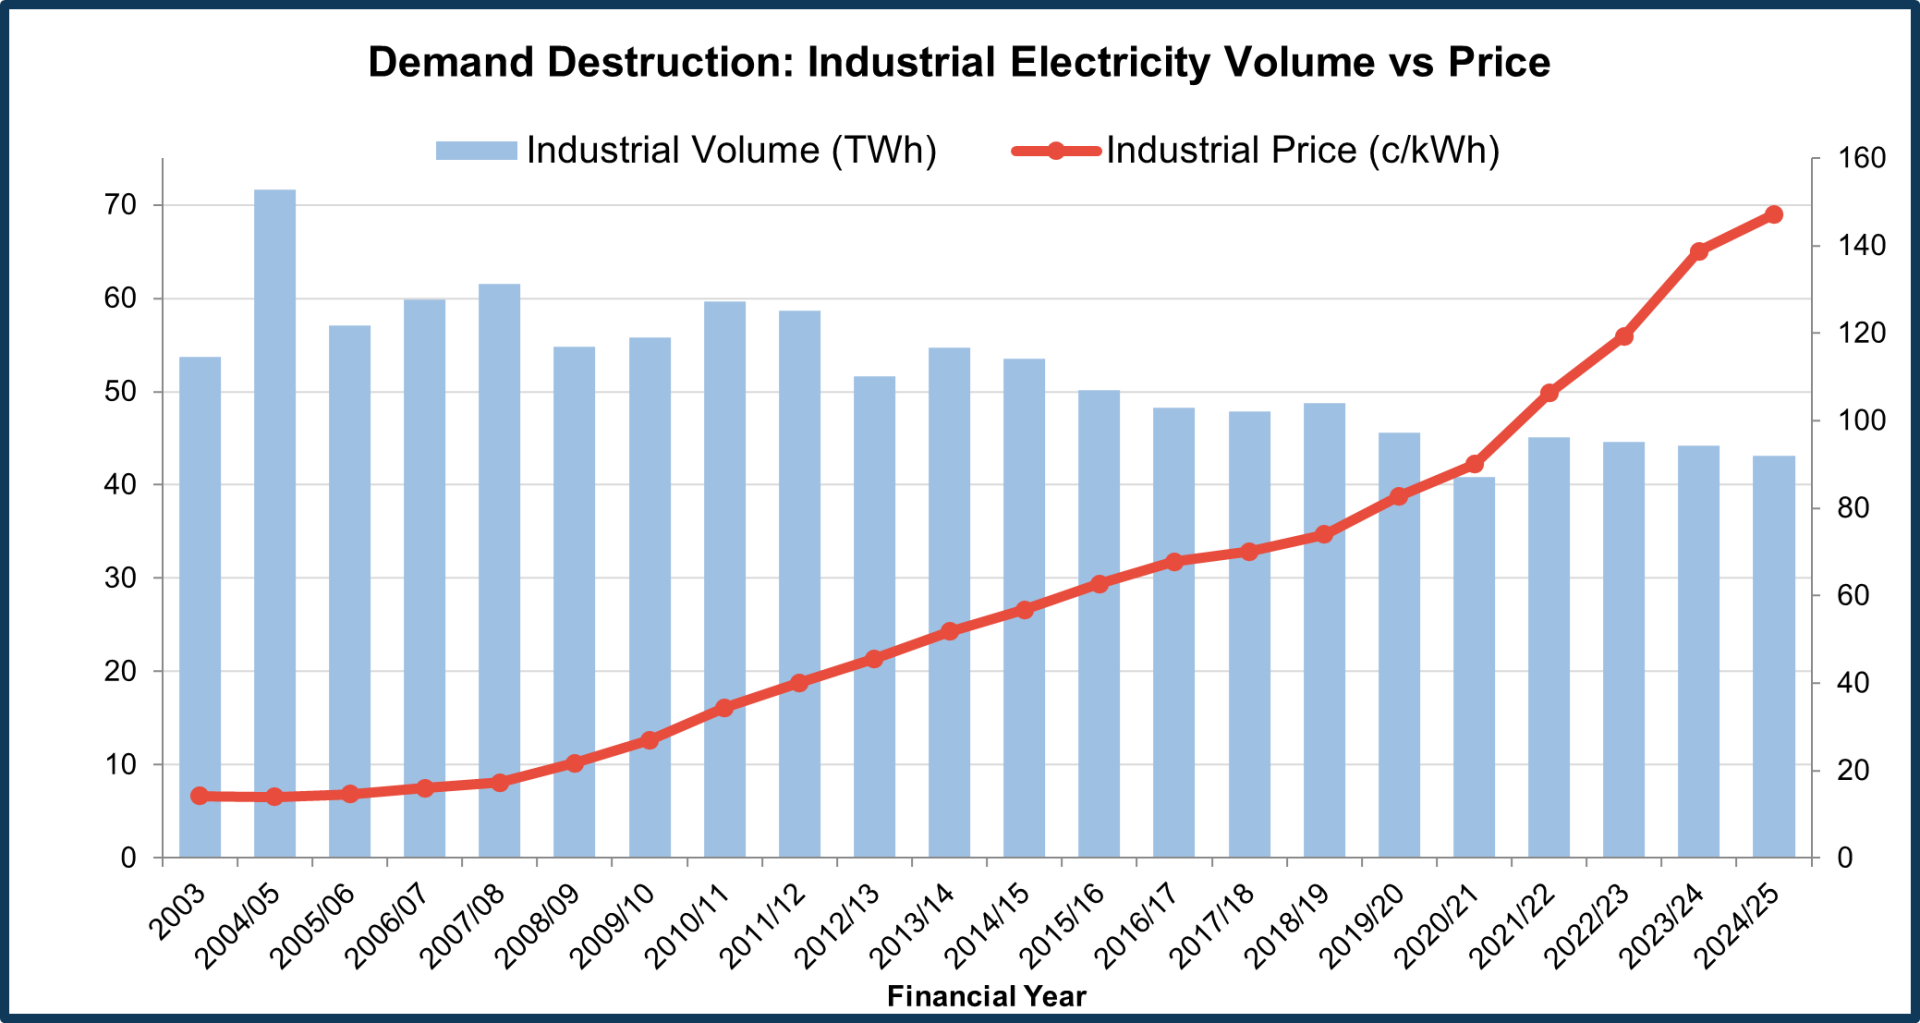
The inverse relationship between price and volume is stark. As tariffs rose, South Africa's industrial electricity demand progressively declined:
- Industrial electricity sales fell from a peak of 71,629 GWh (2004/05) to just 43,153 GWh (2024/25) - a decline of approximately 40%.
- Total Eskom sales volumes dropped from 256,959 GWh at peak to 189,723 GWh - a loss of over 67,000 GWh.
- In the ferrochrome sector specifically, only 11 out of 66 smelters remain operational. While South Africa retains installed capacity of 4.8 Mtpa, actual production has fallen from approximately 3.3 Mtpa in 2024 to an estimated 2 Mtpa in 2025 and was projected to collapse to just 1 Mtpa in 2026 without government intervention.
This is textbook demand destruction: price the product beyond what the customer can afford, and the customer leaves. Permanently.
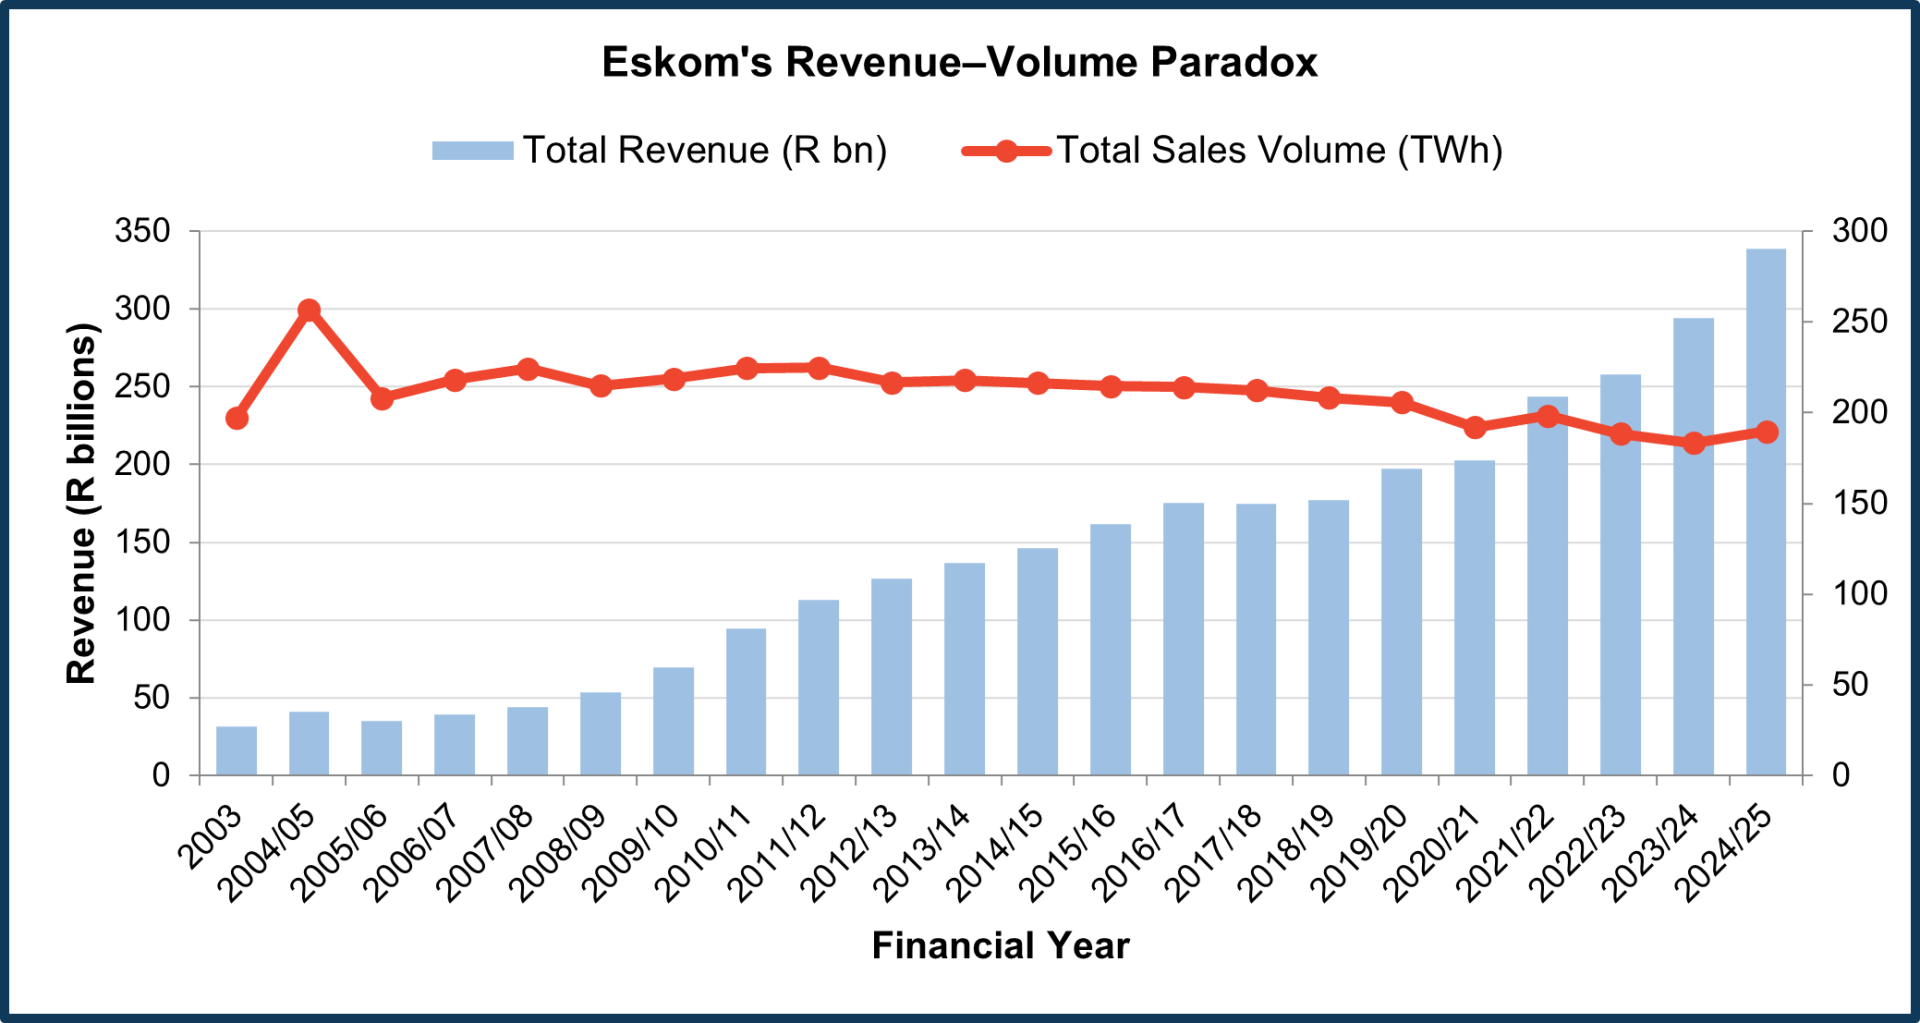
A notable feature of the pricing data is the widening divergence between revenue trends and sales volumes.
- Total revenue grew from R31.6 billion (2003) to R338.9 billion (2024/25), a 10.7x increase.
- Total sales volumes declined by 26% from their peak over the same period.
The available data indicates that revenue has continued to rise even as overall electricity sales volumes have declined. This reflects a pattern in which higher tariffs are applied across a gradually contracting customer base. As tariffs increase, some industrial users reduce operations or exit the system, resulting in lower demand. With a smaller customer base, a greater share of fixed system costs is recovered from remaining users, reinforcing the upward pressure on tariffs over time.
The NPA Smelter Story: From Cheapest to Unsustainable
What Happened to Negotiated Pricing Agreements
The NPA tariff trajectory is perhaps the most volatile and consequential segment of the Eskom pricing data. In 2003, NPA customers, primarily large smelters, paid just 11.88 c/kWh, making South Africa one of the cheapest jurisdictions in the world for energy-intensive metal processing.
For nearly two decades, the NPA rate increased gradually. As recently as 2020/21, smelters were still paying 37.56 c/kWh, expensive by historical standards but manageable from a cost perspective. Then came two significant increases:
- 2021/22: NPA tariff surged from 37.56 c/kWh to 68.13 c/kWh - an 81.4% increase in a single year.
- 2023/24: NPA tariff jumped again from 69.28 c/kWh to 114.57 c/kWh - a 65.4% increase.
By 2024/25, the NPA rate stood at 112.64 c/kWh. For ferrochrome smelters where electricity accounts for up to 40% of production costs, this made South African operations uncompetitive against Chinese producers with access to cheaper coal-fired power.
The 62 c/kWh Intervention: Emergency or Precedent?
Current developments
On 27 February 2026, Electricity Minister Ramokgopa announced what he described as the single biggest announcement of his tenure: a 62 c/kWh electricity tariff for ferrochrome smelters. The offer was made first to the Glencore-Merafe joint venture and will be extended to Samancor Chrome, the two largest producers in the country.
This represents a sharp reduction from the 87 c/kWh interim tariff previously approved by NERSA in January 2026 and effectively halves the rate smelters were paying a year ago.
The Economic Case
The government's stated economic justification is compelling:
- Exports: Boost South African ferrochrome exports by an estimated R76 billion.
- Eskom revenue: Generate nearly R18 billion in new revenue for Eskom through restored demand.
- Tax: Bring in an additional R5.5 billion in government tax revenue.
- Jobs: Protect thousands of jobs under immediate threat through Section 189 retrenchment processes.
- Capacity: Bring up to 45 furnaces back online by end of 2026, growing to 49 by December 2027, up from just 11 currently.
The Open Questions
The intervention, while necessary, raises significant questions for energy policy and regulation:
- Nersa's role: The terms, conditions, and contractual framework still require NERSA’s approval. Given NERSA’s long‑standing role in guiding the evolution of South Africa’s electricity pricing framework, the regulator now plays a critical role in assessing and endorsing this emergency tariff adjustment to support industrial stability.
- Cross-subsidisation: The government has committed to funding the tariff shortfall through Eskom's existing R230-billion debt relief package so that residential and commercial customers do not bear additional cost. The initial interim plan alone was projected to cost R5.2 billion. Ironically, other electricity users were already cross-subsidising smelters under the NPA regime, the new intervention simply shifts this burden from the tariff base to the national fiscus.
- Broader industrial eligibility: If 62 c/kWh is viable for ferrochrome, the pressure to extend similar relief to steel, aluminium, and other energy-intensive sectors will be immediate, and the Minister has already signalled as much, stating "we are starting here, but we are coming to everyone." ArcelorMittal SA's Newcastle plant is already under care and maintenance after Eskom rejected its NPA application despite NERSA ruling it eligible. South32's Hillside aluminium smelter operates under a separate long-term NPA that has itself drawn scrutiny. The precedent set by the 62c tariff creates an inevitable policy question: if government can subsidise ferrochrome to prevent deindustrialisation, how does it justify withholding the same from steel, aluminium, and other foundation industries?
- Structural vs temporary: Sustainability beyond the emergency: The NERSA-approved 87c/kWh intervention is explicitly designed as a 12-month emergency measure running to December 2026. The subsequent 62c/kWh framework is positioned as a longer-term solution, but its duration, take-or-pay terms, and contractual structure remain under negotiation and subject to NERSA approval. Without a permanent restructuring of Eskom's pricing framework, one that addresses the structural cost escalation that created this crisis, the same dynamics will reassert themselves once any time-bound relief expires. As FAPA warned, interim measures may only delay retrenchments by months, not prevent them.
The Bigger Picture: South Africa's Competitive Erosion
Chrome: From Dominant to Dependent
South Africa holds an estimated 70–80% of the world's known chrome reserves, yet China, with less than 1% of global chrome deposits now accounts for the majority of global ferrochrome output. The mechanism is straightforward: unaffordable electricity forced South African producers to shut smelters and export raw chrome ore, of which South Africa shipped 17.8 million tonnes in 2023 alone, almost all of it to China, where it is processed using cheaper power into higher-value ferrochrome for stainless steel production. This represents a massive value transfer: South Africa extracts the raw material and bears the environmental cost but loses the beneficiation revenue and industrial jobs to a country with virtually no chrome resources of its own.
Steel: ArcelorMittal's Distress
The same electricity price dynamics have brought ArcelorMittal South Africa to its knees, forcing the closure of its Newcastle long steel plant. The company is in discussions with the Industrial Development Corporation and government, but rising Transnet freight charges compound the electricity burden. Exclusive talks between ArcelorMittal and the IDC ended without a deal.
The Agricultural Squeeze
The data reveals agriculture has absorbed the single largest increase of any sector, from 29.14 c/kWh to 308.19 c/kWh, a 10.6x increase. For an already drought-stressed farming sector reliant on irrigation pumps, cold storage, and processing, these increases translate directly into food price inflation and reduced competitiveness on export markets.
What the Data Demands
The data is unambiguous in its implications. Two decades of above-inflation tariff increases have:
- Reduced industrial electricity demand.
- Driven South Africa from the world's top ferrochrome producer to a raw ore exporter.
- Generated increase in Eskom’s revenue, even as its customer base decreased over time.
- Created a pricing structure where the standard industrial tariff (195.95 c/kWh) is more than 3x what smelters say they need to break even (62 c/kWh).
The 62 c/kWh tariff intervention is a necessary emergency measure. But it also exposes a fundamental truth that has been evident in the data for over a decade: South Africa's electricity pricing model is incompatible with an industrial economy. The question is no longer whether the pricing framework needs to change, but whether the political will exists to restructure it before there is no industrial base left to save.
09 March 2026 Minerals & Mining Energy Efficiency & Conservation Policy & Regulatory Affairs African Competitiveness Energy Transition

Dr. Davies Tsikayi
Energy Specialist